A Fresh Look at 2024 Energy Costs by State
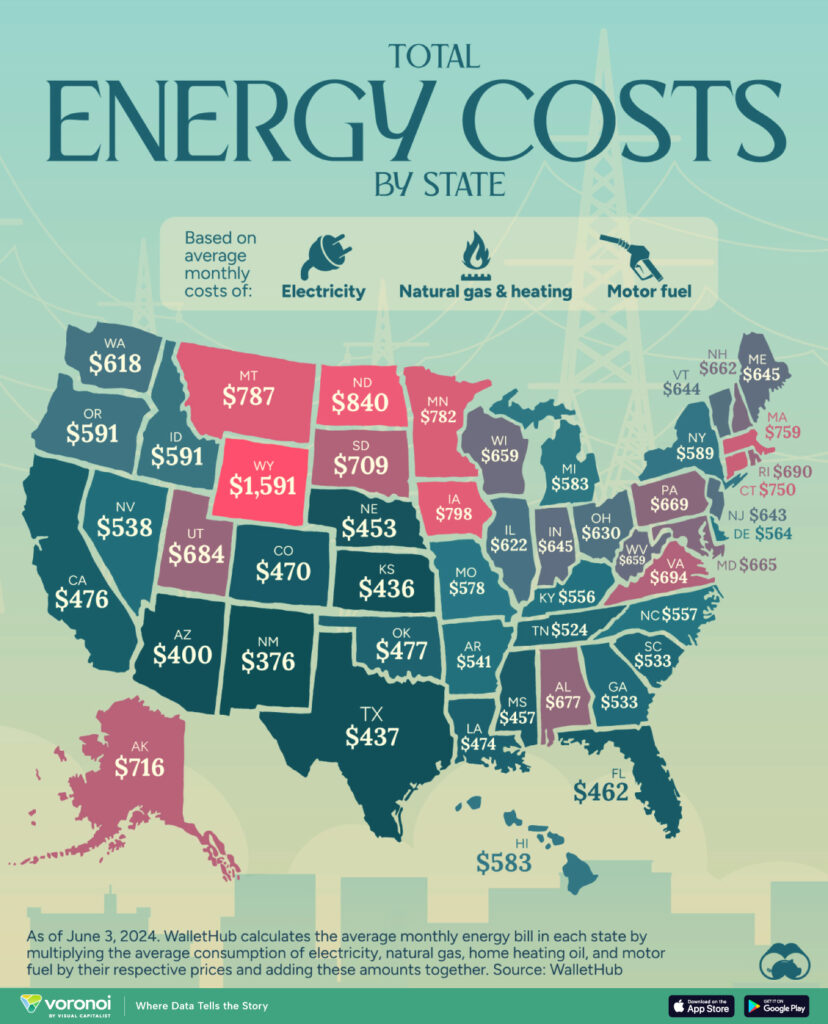
Ever wondered how much energy costs vary depending on where you live or work? A new graphic from Voronoi breaks down the average monthly energy costs by state across all fuel types, giving valuable insights.
For building owners and managers, energy costs are significant. Whether it’s a home or high-rise, the price of keeping it powered is a big part of the budget. This graphic highlights the differences in energy costs across states.
As Josh Keeling from UtilityAPI notes, it’s not just about cents per kWh or therm; it’s about how much of the budget energy takes up—often beyond anyone’s control. This graphic shows why energy costs are more than a line item; they’re a major factor for anyone managing a building’s finances.
And the concern isn’t just about today’s prices. When upgrading or maintaining energy systems, it’s essential to consider future costs across fuel types and anticipate trends. Smart choices now can set buildings up for shifts down the road.
While a broad view is helpful, a deeper, state-by-state assessment provides real value for building owners looking to improve efficiency and manage costs.
Related Articles
Check out the latest from our blog…
Want to know more about our whole building Benchmarking Application?
Looking for additional resources?
Head to our Resources page for more industry perspectives and product information.
